
Reason to trust
Strict editorial policy that focuses on accuracy, relevance, and impartiality
Created by industry experts and meticulously reviewed
The highest standards in reporting and publishing
Strict editorial policy that focuses on accuracy, relevance, and impartiality
Morbi pretium leo et nisl aliquam mollis. Quisque arcu lorem, ultricies quis pellentesque nec, ullamcorper eu odio.
The Ethereum price performance in the month of May has been nothing short of outstanding, surging by more than 35% in the past two weeks. After making a strong run toward the $2,700 mark on Tuesday, May 13, the altcoin’s price has struggled to build on its momentum over the past few days.
The price of ETH did manage to stay above the $2,500 mark over the past week, bouncing back from the psychological level on Thursday, May 15. However, the recent struggles seem to have compounded over the weekend, with the Ethereum price losing the $2,500 level to end the week.
The Next Support Cushion For ETH Price
Prominent crypto analyst Ali Martinez took to the social media platform X to share an interesting on-chain outlook on the price of Ethereum and its latest lack of bullish momentum. Following the dip of ETH beneath the $2,500 mark, the online pundit has identified the altcoin’s next significant support level.
Related Reading
This evaluation revolves around the average cost basis of several Ethereum investors. Cost-basis analysis basically measures the ability of a price level to act as support or resistance — based on the total amount of coins last purchased by investors at this level.
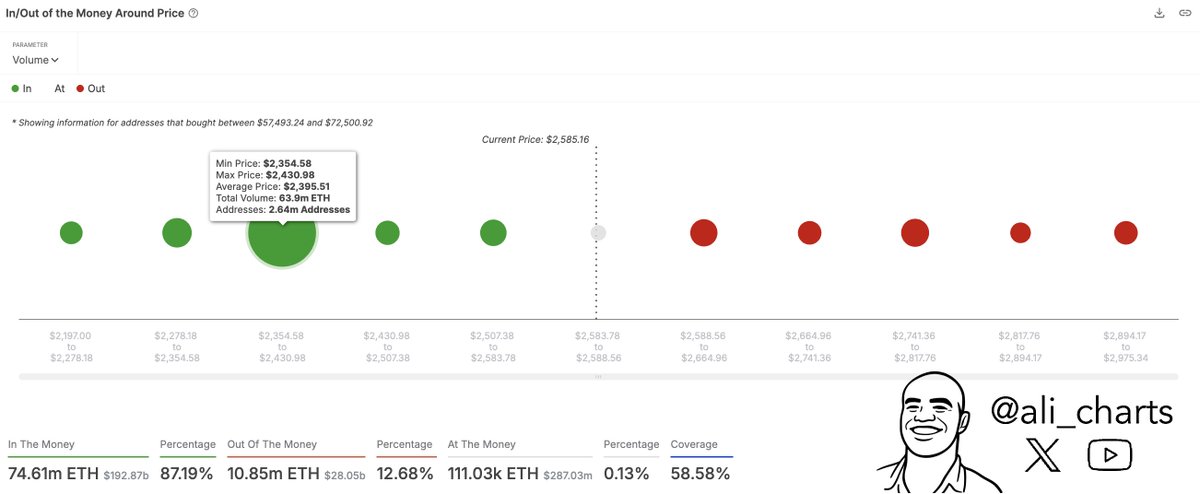
As shown in the chart above, the size of the circles directly corresponds with the quantity of ETH tokens bought within each price zone and the region’s significance as support or resistance.
In essence, the bigger the dot, the higher the number of tokens, and the stronger the support or resistance; the green dots are support (as they are usually below the current price), while the red dots represent resistance (as they are above the asset price).
Data provided by Sentora (formerly IntoTheBlock) shows that the Ethereum price has key support around the $2,354 – $2,430 zone, where 2.64 million addresses purchased 63.9 million tokens (worth $153.04 billion at an average price of $2,395).
As Martinez highlighted, this price bracket would serve as an on-chain cushion for the ETH price, as investors with their cost bases around the level would likely defend their positions by buying more tokens if the price falls toward $2,400. The fresh buying pressure around this price region would help counter the downward pressure, thereby keeping the Ethereum price afloat.
The highlighted chart shows that it is all clear blue skies for the price of Ethereum, with no significant resistance lying ahead. However, the altcoin will need to hold above the $2,400 level, or it risks falling to as low as $2,200.
Ethereum Price At A Glance
As of this writing, the price of ETH stands at around $2,480, reflecting a 0.7% increase in the past 24 hours. According to data from CoinGecko, the altcoin is down by nearly 4% on the weekly timeframe.
Related Reading

Featured image from iStock, chart from TradingView