
Meme cryptocurrency Dogecoin has extended its price movements below $0.2 over the past 24 hours. Notably, the recent brief rally among cryptocurrencies hasn’t been enough to push the Dogecoin price above $0.2, lending voice to the notion that Dogecoin might have already reached its cycle top after peaking at $0.48 in December 2024.
However, a historical indicator developed by crypto analyst Dima Potts may offer some clues about where Dogecoin currently stands within its market cycle.
The Cycle Indicator That Has Predicted Dogecoin Tops Before
The chart shared by Dima Potts highlights Dogecoin’s behavior across multiple market cycles, using a custom-built indicator involving the interaction of two waveforms and a static red baseline. According to Potts’ analysis, Dogecoin’s major tops historically align with specific signals from this setup. Early cycle tops occur when the yellow wave dips beneath the green wave, while late cycle tops are confirmed once the yellow wave crosses below the horizontal red line.
As simple as it may seem, this pattern has proven reliable in previous Dogecoin cycles. The first instance was in 2014, when the yellow line’s drop beneath the red line correctly marked a significant top. The 2017–2018 cycle experienced two major peaks, each corresponding to the predicted indicator points.
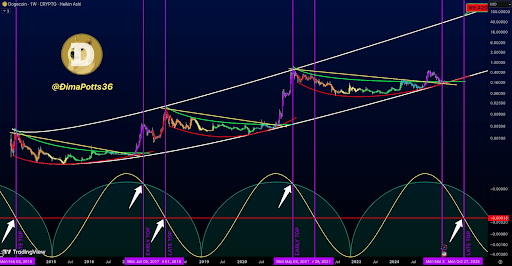
In the 2021 cycle, only an early top was registered, occurring when the yellow wave fell under the green line without triggering the late top signal. Interestingly, each major rally notably touched or slightly exceeded the upper boundary of a broad white trendline channel that frames Dogecoin’s longer-term price movements.
Current Cycle Update: DOGE Building Toward A Late Top In October 2025
As shown in the chart structure above, Dogecoin is still following its larger pattern of oscillations within the white upward channel. The price has remained relatively close to the lower trendline of this channel in recent months, suggesting that a more aggressive breakout could still be ahead if the price bounces. According to the indicator, the possibility of another explosive move is still alive until the yellow wave crosses below the red baseline.
For the ongoing cycle, Potts points out that no early cycle top has been recorded yet, although one might have already occurred around late March. However, the important late-cycle top that will be the final peak has not yet been confirmed. Based on the projected intersection of the yellow wave and the red horizontal line, the analyst predicted that a major top would form around the week of October 27, 2025.
In terms of a price target, the analyst forecasted a price target above $10. Although the forecast of $10 or higher is extremely bullish, the broader structure shown in the chart, combined with the timing patterns from previous cycles, lends support to this prediction. If the current leg of the rally is confirmed and Dogecoin re-tests the upper boundary of the white channel as it did in prior cycles, the technical forecast points to a potential price level as high as $69.4
At the time of writing, Dogecoin is trading at $0.18.

Featured image from Getty Images, chart from Tradingview.com

Editorial Process for bitcoinist is centered on delivering thoroughly researched, accurate, and unbiased content. We uphold strict sourcing standards, and each page undergoes diligent review by our team of top technology experts and seasoned editors. This process ensures the integrity, relevance, and value of our content for our readers.