Reason to trust
Strict editorial policy that focuses on accuracy, relevance, and impartiality
Created by industry experts and meticulously reviewed
The highest standards in reporting and publishing
Strict editorial policy that focuses on accuracy, relevance, and impartiality
Morbi pretium leo et nisl aliquam mollis. Quisque arcu lorem, ultricies quis pellentesque nec, ullamcorper eu odio.
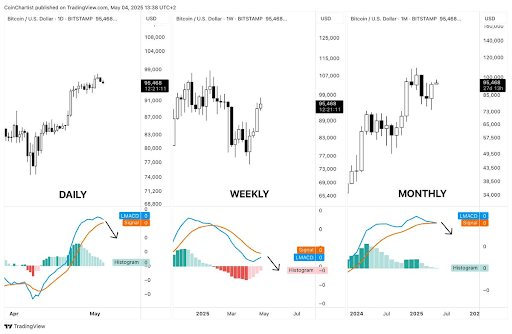
The Bitcoin price faced a rejection following its surge to $97,000 last week. Technical expert Tony Severino has commented on this development and alluded to the LMACD indicator, which has revealed what is next for the flagship crypto.
What Is Next For The Bitcoin Price After Rejection At $97,000
In an X post, Tony Severino stated that multiple BTC timeframe analyses using the LMACD indicator suggest that the Bitcoin price is in a precarious position. He remarked that if the daily momentum crosses bearish, it could prevent the weekly bullish crossover and pull the weekly LMACD below zero. This would cross the monthly LMACD back bearish.
Related Reading
With several important timeframes in sync, Severino warned that market participants could see a more aggressive down move for the Bitcoin price. On the other hand, the technical expert noted that the daily LMACD diverging upward could cross the weekly bullish and avoid another monthly crossover, which could be bullish.

However, he suggested that a Bitcoin price decline is more likely at the moment, as the monthly LMACD is the most dominant of the three signals, which looks to hint at a downtrend. He added that this indicator also has the strength to pull the other timeframes with it. Severino failed to mention how low BTC could drop on this projected price decline.
Meanwhile, crypto analyst Ali Martinez also warned about a potential Bitcoin price decline. In an X post, he stated that BTC could soon pull back as the TD Sequential indicator is flashing a sell signal. The analyst warned that if Bitcoin loses the $94,765 support level, it could drop to as low as $90,000 or even $86,000.
How History Could Repeat Itself For BTC
Crypto analyst Rekt Capital raised the possibility of the Bitcoin price repeating a similar move from last year. For history to repeat itself, he noted that BTC would need to reject from $99,000, hold above $93,500, break the $97,000 to $99,000 range, reject from $104,500, hold the $97,000 to $99,000 range as support, and then break out to new all-time highs (ATHs).
Related Reading
Commenting on the current price action, crypto analyst Titan of Crypto noted that the Bitcoin price is pulling back to a key support confluence. He added that a strong reaction from this current zone would confirm that the upward trend remains intact. His accompanying chart showed that the $95,423 price level is the area to watch. Failure to reclaim this level soon enough could start a downtrend for the flagship crypto.
At the time of writing, the Bitcoin price is trading at around $94,700, down in the last 24 hours, according to data from CoinMarketCap.
Featured image from Unsplash, chart from Tradingview.com


