Reason to trust
Strict editorial policy that focuses on accuracy, relevance, and impartiality
Created by industry experts and meticulously reviewed
The highest standards in reporting and publishing
Strict editorial policy that focuses on accuracy, relevance, and impartiality
Morbi pretium leo et nisl aliquam mollis. Quisque arcu lorem, ultricies quis pellentesque nec, ullamcorper eu odio.
Solana is currently consolidating just below the $180 level after a strong rally, facing clear resistance as bulls attempt to maintain momentum. While the overall structure remains bullish, upward progress has stalled, and the market is entering a more cautious, tense phase. Buyers are still in control, but they’re struggling to push SOL decisively through this key barrier, keeping the price range-bound in the short term.
Related Reading
Adding to the intrigue, new data from Glassnode reveals that Solana is the only top 10 cryptocurrency (excluding stablecoins) with a negative funding rate. This could signal the early stages of short-side pressure building in the derivatives market. Negative funding suggests that traders are increasingly betting against the asset, even as spot price action holds relatively firm.
This divergence between price consolidation and growing bearish positioning could act as a short-term catalyst if bulls regain momentum. Alternatively, it may hint at hesitation from traders who see limited upside in the immediate term. With sentiment on edge and key levels in play, Solana’s next move could set the tone for broader market behavior in the days ahead.
Solana Faces Key Test After Rally
Solana is at a critical inflection point after gaining more than 95% in value since April. The explosive rally has pushed SOL back to a major resistance zone, where previous supply has repeatedly capped upward momentum. Now, bulls must confirm the uptrend by pushing above this level and establishing a new higher range. A successful breakout here could solidify Solana’s bullish structure and set the stage for a move toward $200 and beyond.
However, risks remain. While Solana has outperformed most top assets in recent weeks, some analysts warn that the broader crypto market may be approaching a short-term correction. With Bitcoin consolidating near its all-time highs and macroeconomic conditions tightening, any downside pressure could drag altcoins—including Solana—lower before continuation.
Adding to the uncertainty, Glassnode shared a notable data point showing that Solana is currently the only top 10 crypto asset (excluding stablecoins) with a negative funding rate. At -0.0002%, it’s a small shift, but one that may signal the early stages of bearish positioning among futures traders. Negative funding means that short sellers are paying to hold their positions, potentially indicating growing skepticism about short-term upside.

This divergence between bullish spot performance and subtle bearish sentiment in derivatives could set up a high-stakes move. If bulls can absorb the pressure and flip resistance into support, Solana could enter a fresh price discovery phase. But if selling intensifies and funding remains negative, a deeper pullback may be on the horizon. For now, SOL is at a key decision point—and the next move could set the tone for the weeks ahead.
Related Reading
SOL Approaches Resistance As Weekly Structure Turns Bullish
Solana (SOL) is currently trading at $175.68 on the weekly chart, consolidating just below the $180 resistance zone. After a strong rebound from April’s lows near $90, SOL has gained over 95% and is now approaching a critical level that has historically acted as a supply zone. The recent bullish momentum is notable, with three consecutive green weekly candles and price now trading above the 34-week EMA at $164.82—a level that previously capped upside attempts.
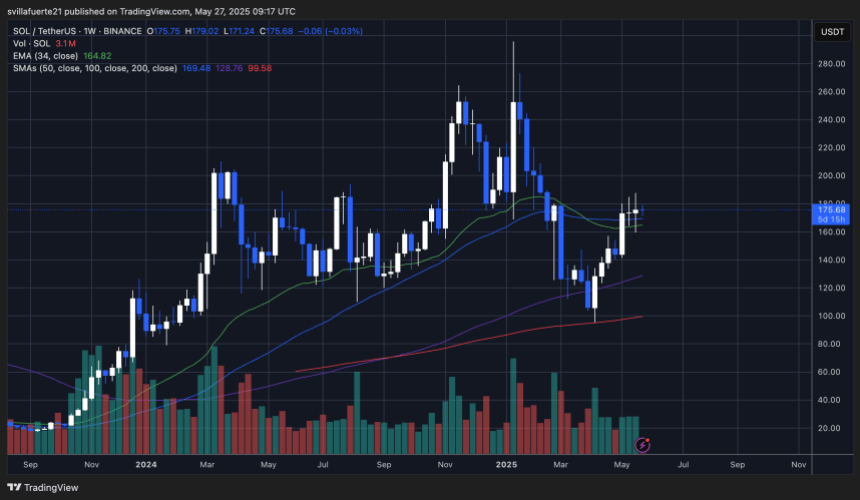
The 50-week SMA at $169.48 has also been reclaimed, reinforcing the strength of the current move. Volume remains steady, suggesting buyer conviction is still intact as SOL pushes into this resistance zone. The next key test lies in whether bulls can break and close above the $180–$185 area, confirming a structural breakout and opening the door for a potential retest of the $200–$220 range.
Related Reading
Failure to reclaim this zone could lead to short-term consolidation or a mild pullback toward the 34 EMA or 50 SMA. However, the current trend favors bulls, with higher lows and stronger weekly closes indicating sustained accumulation. If broader market conditions remain stable, Solana looks poised to attempt a breakout in the coming weeks.
Featured image from Dall-E, chart from TradingView